Datavis
Going Big For Mass Media
JAMES GOLDIE
Data and Digital Storytelling Lead, 360info
Today
- Why talk to mass media?
- Graphics for broadcast
- Working with broadcasters and journalists
- Emergency broadcasting
- Q&A
Slides
https://datartathon2022.talks.jamesgoldie.dev
(Code for these slides is at https://github.com/jimjam-slam/talk-datartathon-datavis-2022)
Hi!


360info is an open access global information agency that tackles the world’s biggest challenges and offers practical solutions.
Why work with
mass media?
"Media polarization and fragmentation… provide favourable opportunity structures for people to seek information in line with their prior beliefs."
Trust
Sources of climate change news you trust (n = 2038)
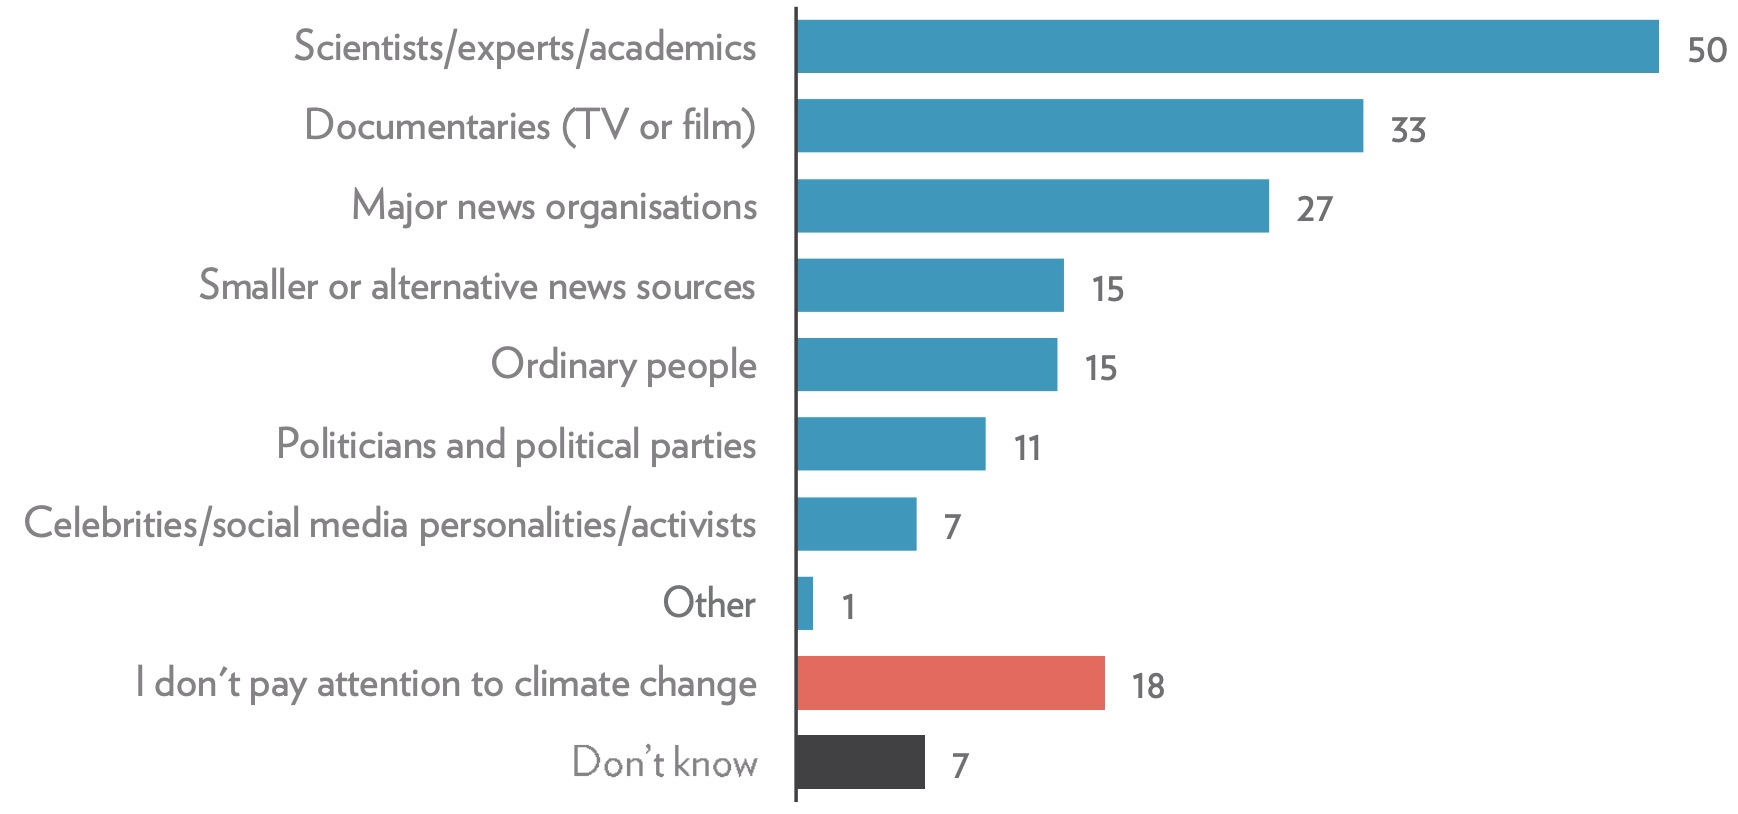
Barchart showing various sources of information on the Y-axis and the fraction of surveyed people who trust them to deliver claimate change information on the X-axis.
As researchers, you have the opportunity to build social consensus for a policy action or change through mass media
Graphics for broadcast
Alternatives

Display time:
7-10 seconds
Reading time:
11 minutes (excluding graphics)
Attention span
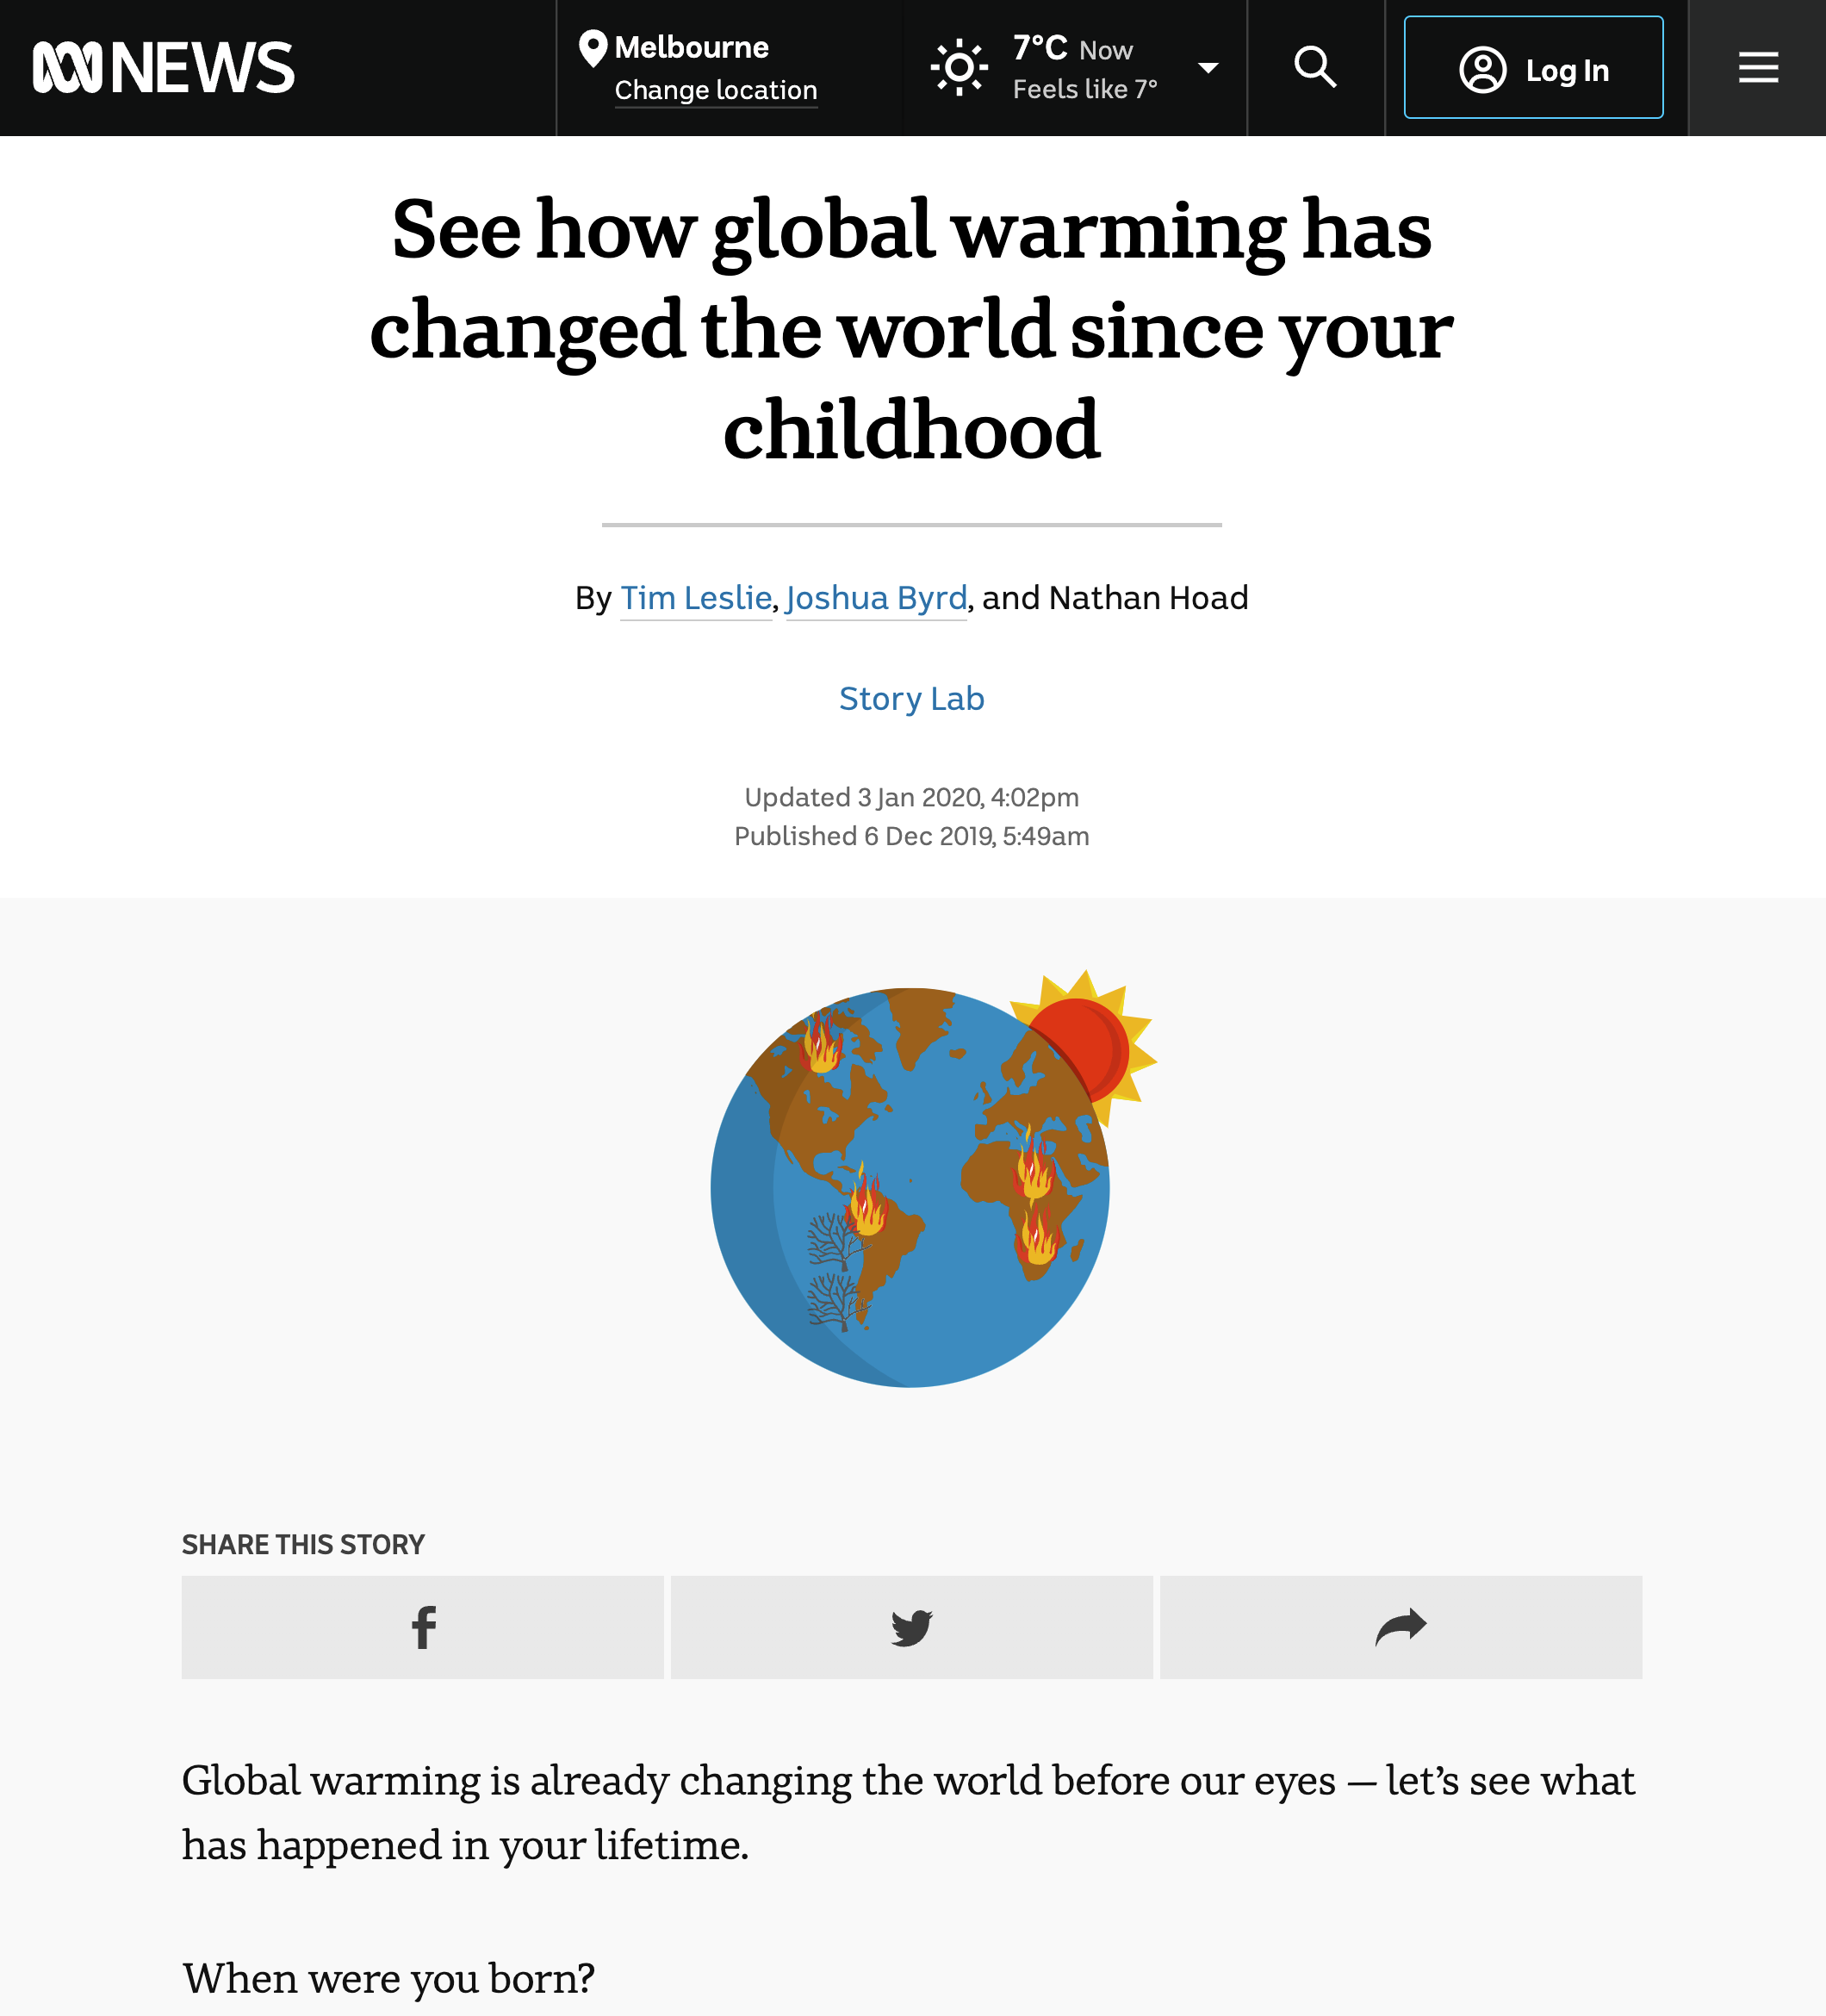
Part of a long-form interactive story
Long-form online video
Blog post
Regular news articles
TV news segment
Short-form online video
A single shot in a TV news segment
Many minutes, very engaged
A few seconds, a little engaged
Complex ideas, built up gradually
(Very, very, very) simple ideas
Considerations for TV
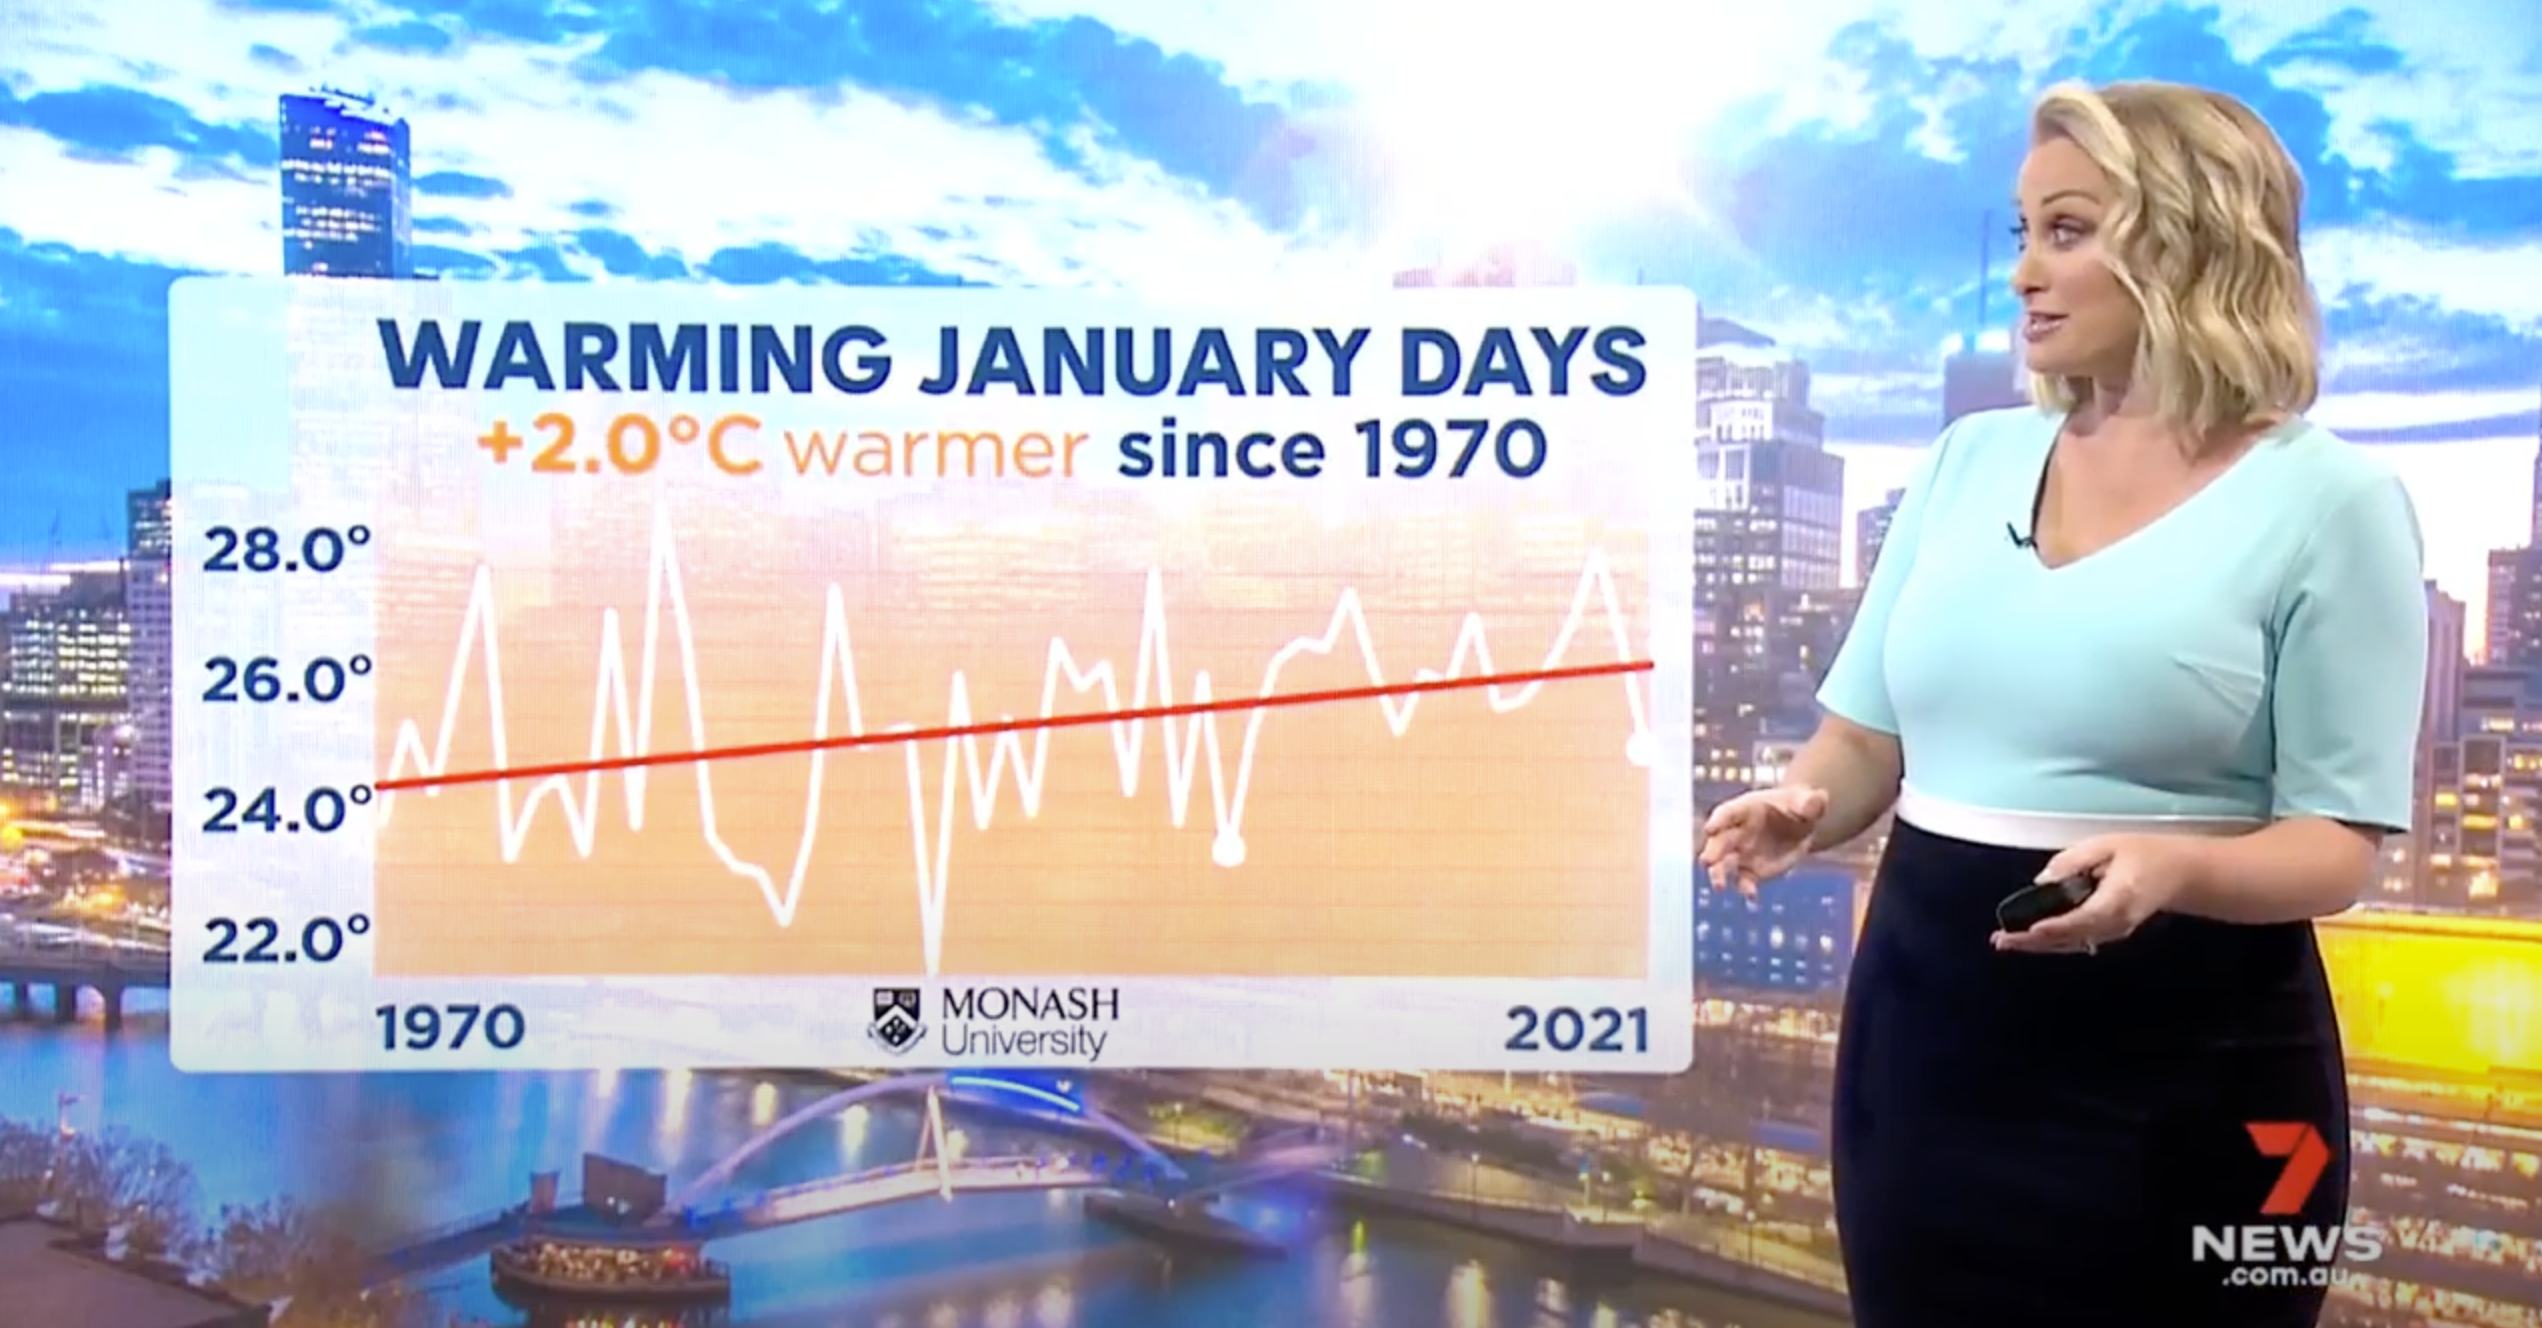
- Short text
- “Editorialised” headline or labels
- Thick text and lines
- Contrast and colour focus
- (This example’s not great for contrast! 😅)
- Presenter position
Considerations for TV
Primary messages
- Trend line up
- Warming
Secondary messages
- Year-to-year variability
- Length of data record
Working with
broadcasters and journalists
Types of folks you’ll meet
In broadcast:
Reporters and producers
Presenters
Graphics teams
News directors
In print and digital:
Reporters/journalists
Editors
Data journalism team
(Data journo, designer, coder)
Newsroom resourcing
Journalists who are looking for a particular story are time-poor
Look for opportunities to push stories to journalists and develop relationships
Emergency communication
EXTRA NOTE
Things to remember (for doing media) during a disaster
- Ask questions about context
- What kind of show is it? News? Analysis?
- Graphics context
- Do your titles and labels make the non-emergency context clear?
- Do colours, icons or words conflict with official warning messaging?
Conclusions
Mass media is a great way for researchers to affect change!
Keep your graphics simple and think about the primary message
Journos are time-poor too.
You can understand each other.
Be careful communicating during a disaster
Thanks for listening!
Questions?